This first week’s readings explore the structure and nature of inequality in the US over time, and its persistence.
Inequality in the US has been increasing since the early 1970s, but what was the trend before that time? In 2003, economists Piketty and Saez published a study of the long-term trends in inequality in the United States using tax return data. Their analysis concluded that top income shares (one measure of inequality) dropped sharply during the periods of WWI and WWII, and then largely stagnated until the early 70s when top income shares began to rise again, especially for the top 1 percent.
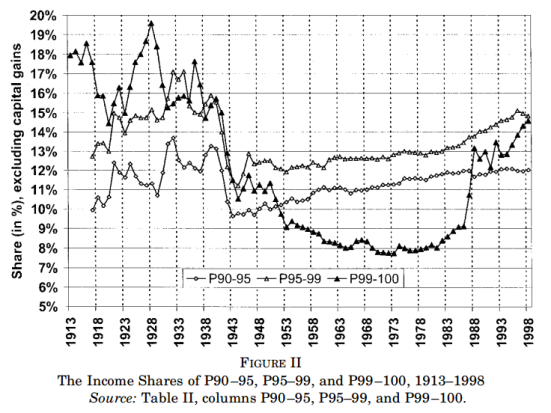
[Image from Piketty and Saez (2003) page 12]
Also interesting is their discovery that the make up of top incomes has seen a long-term shift from favoring capital to favoring wage income. (The authors note that this decreased share of capital income is a result of decreased concentration, not a relative loss of capital income shares in the larger US economy) This shift represents partially changes to the tax code over time including trends in progressive taxation, the 1986 Tax Reform Act and an increase in retirement dividends that are not reported as such. It also maps with the development of stock options and the increase in average CEO compensation since the 1970s. However, more recent increases in capital income has resulted in some researchers to criticize their conclusion in a permanent shift in income compensation premature.
Piketty and Saez later joined with Anthony Atkinson in 2011 to conduct an analysis of top incomes in twenty-two different countries to compare trends across the globe. They found that most countries experienced a drop in top income shares over the first half of the twentieth century during the wars, which then stagnated over a period similar to the United States. However, they find that the last thirty some years have seen a divergence across countries, with top income shares growing in the US, UK, Canada, Australia, Ireland, New Zealand, China and India, while not growing in France, Netherlands, Japan, Germany or Switzerland. They also conclude recent increases in other countries are also due to increases in top wage incomes.
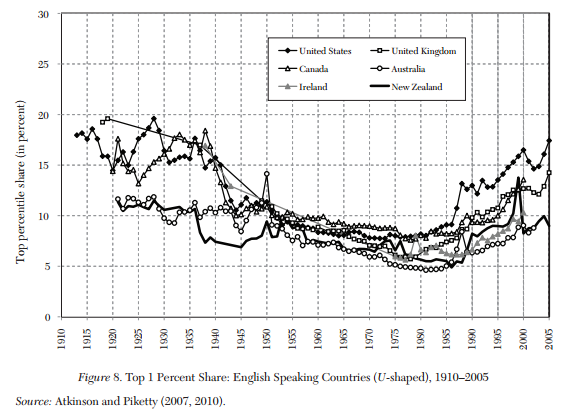
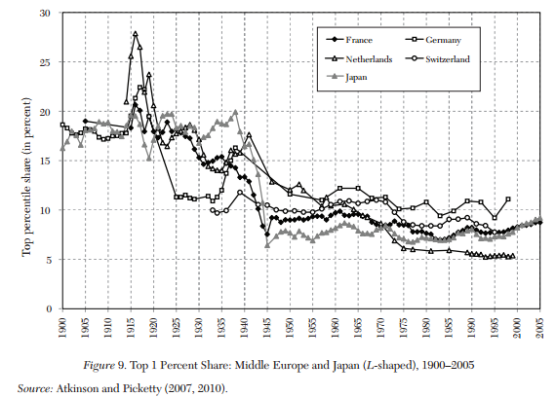
[Images from Piketty and Saez (2011) pages 41-42]
A variety of explanations for this divergence were considered by the authors as avenues for future research, including differences in progressive taxation, macroeconomic shifts and political changes.
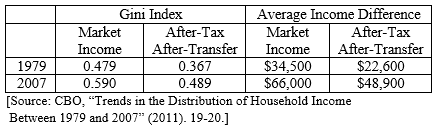
In context of the broader picture, the Congressional Budget Office in 2011 published an analysis of Trends in the Distribution of Household Income Between 1979 and 2007, in which they found similar trends as Piketty and Saez in increased inequality and increased concentration of labor income. The CBO report also examined the impact of taxes and transfers on inequality. They found that while government taxes and transfers do reduce inequality, “the equalizing effect of transfers and taxes on household income was smaller in 2007 than it had been in 1979.” In other words, while government policies consistently reduced inequality over this time period, those policies weren’t as effective at reducing inequality in 2007 as they were in 1979.
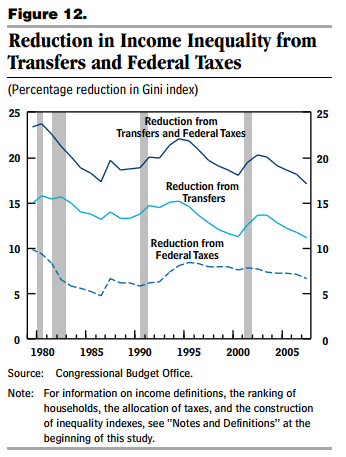
[Images from CBO Report (2011) page 20]
So what does this mean in real terms? Using the Gini index as a measure of inequality, CBO calculated that in 1979, government taxes and transfers reduced the average difference in income between pairs of households from a difference of $34,000 to $22,600. In 2007, the average pre-tax and transfer difference of $66,000 was only reduced to $48,900:
The report highlights two main explanations for the reduced redistributive power of government policies. First, transfers to the elderly population through Social Security and Medicare have increased significantly, which are not limited to low-income households. Second, less-progressive payroll tax rates increased while more-progressive income tax rates decreased. In future weeks I will explore the role of taxes and transfers on inequality in more detail, but for now it is enough to highlight the major trends.
There are a variety of challenges to the evidence provided by tax data, namely that it does not allow for the identification of important factors like race and gender roles, does not include the entire population, and the size of each tax unit has decreased over time. The authors acknowledge and address these concerns in more detail than I will explore here. However, analyses using other sources of data including census survey data have identified similar trends, if not to the same degree. [See Atkinson, Piketty and Saez (2011) pages 29-34 for more details.]
Another question that regularly arises is the role of income mobility in larger trends. The tax unit data points (households) within each income bracket in 1979 are not the exact same as those in 2007, for example. People may go up and down income percentile groups as a result of increased education or skills, sudden illness, household structure, and lifecycle trends. However, Debacker et. al in Rising Inequality: Transitory or Persistent? use microlevel tax data in an attempt to separate the transitory and persistent components:
Persistent: Differences in permanent characteristics such as education and unobserved ability, as well as long-term shifts as a result of “chronic illness or the permanent loss of a high-paying job.”
Transitory: “temporary illness or transitory unemployment”
The authors conclude that the most of the changes to inequality can be explained by the persistent components. This has implications for future policy and research, suggesting that macro changes to the economy such as technological increases and cultural shifts in compensation policy may better explain trends in inequality than income mobility explanations.
So, what do we know?
- Income inequality dropped sharply over the first half of the 20th century before rebounding in the last 30 some years.
- Increases in the top 1 percent are especially high.
- This more recent increase in inequality in the US shares trends with some developed countries across the globe, but not all, complicating global macroeconomic explanations.
- Increases in wage income at the top (rather than capital income) explains the majority of the increase in inequality
- US tax and transfer policy reduces inequality but did not do as well in 2007 as 1979
- Most of these changes are persistent in nature, meaning big picture trends should explain the increase in inequality more than individual mobility across income brackets.
Next week I’ll be exploring the role of technology and capital in inequality. Feel free to leave comments or contact me with questions through the Contact page.
You can find the reading list I will be following throughout this series linked to my first blog post.
